UBPR Analytics
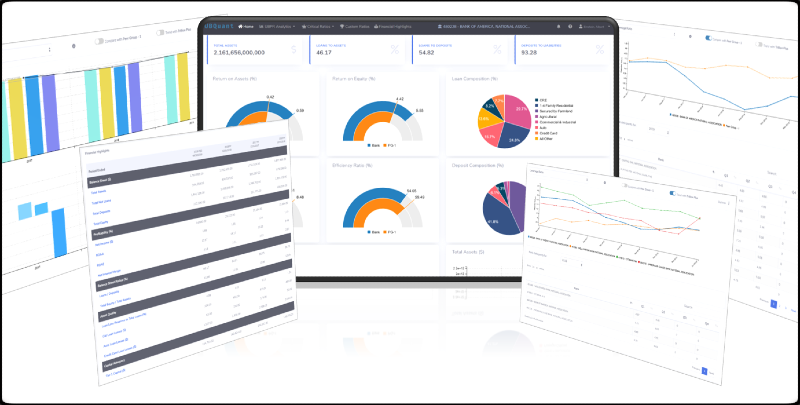
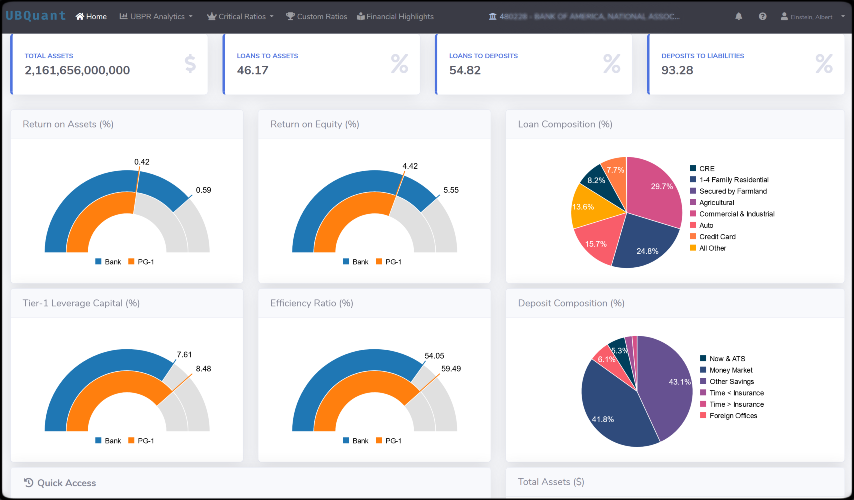
Analyze bank performance by visualizing any UBPR or call report metric. Access your Financial Highlights or compare with peer groups or trend with your peer banks with our fast, intuitive and responsive interfaces.
Learn MoreCustom Ratios
Critical Ratios offers leading key metrics to drive your performance insights beyond the standard UBPR ratios. Custom Ratios lets you to take your analysis to next level by defining your own set of formulas with MyFormula.
Learn MoreBenchmarking
Evaluate your bank performance using standard or critical financial ratios. Compare with your custom peers or regulatory peer group averages or watchlist trends, augmented with individual bank data points.
Learn More
Reports give you information. Analytics give you insights.
Not just simplifying UBPR analysis, enhancing it. While a typical UBPR report provides you necessary information, UBQuant analytics drives you towards better insights. UBQuant offers a comprehensive analytics solution for the bank UBPR/Call Report analysis with fast, interactive, and responsive interfaces. The UBQuant interface for any visualization includes bank view with % change, peer average comparisons, and watchlist trending, along with downloadable respective individual bank data. UBQuant offers a comprehensive analytics solution for the bank UBPR analysis. Our platform empowers banks in developing forecasting models, regulatory compliance models, benchmark analysis with peer-groups, and more.
At UBQuant, our mission is to bring better insights for data driven decisions and we develop dedicated solutions for bank performance evaluation. Using our intuitive visualizations, compare your custom peers or regulatory peer group averages or watchlist trends, augmented with individual bank data points. Our Critical Ratios offers leading key metrics to drive your performance insights beyond the standard UBPR ratios. Build your own performance stories by modeling with your custom ratios by defining your own formulas to turn the bank financial data into actionable insights. From Summary Ratios to Fiduciary & Related Services, all regulatory categorized UBPR metrics organized for intuitive access and better analytics. Plus, research analysis on any UBPR or Call report metric.
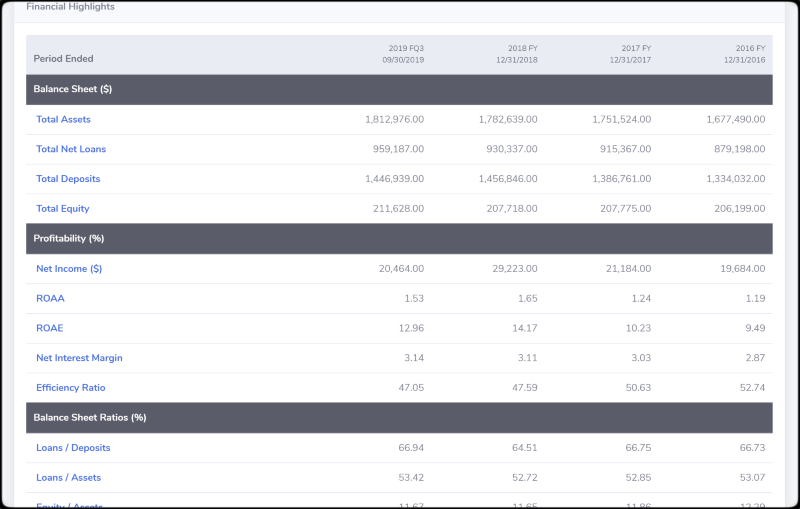
Request DemoFinancial Highlights provide a standardized dynamic and explorable snapshot of 4-year financial report highlights. The metrics include most critically assessed metrics for easy reporting and a one-click drill-down to compare/trend with any peer group or trending. UBQuant pre-defines CAEL metrics (Capital Adequacy, Asset Quality, Earnings, Liquidity) and more as Critical Ratios with real-time formula-based computations to provide deeper insights.
Request DemoCustom Ratios are user-defined calculated metrics that are computed from existing call or UBPR metrics to drive more relevant analyses for a greater actionability without leaving the product. Take your evaluation to next level with real time formula computing - define your own set of formulas and design your way of analyzing with Custom Ratios. UBQuant pro users can define their own custom formula ratios to build their personal set of analytics. Real-time computations yield instant results along with peer computations and trends. No limitations or restrictions on metrics – any valid Call and/or UBPR metric combination can be used.
Request DemoRecent Posts
-
Bank Efficiency Ratio
In today’s environment, one of the most significant ongoing concerns for bank executives is to carefully orchestrate growth with...
Read More -
Get your best benchmarking
Peer groups are used, in general, for benchmarking. We all want to know, “How we are performing or matching up with our peers”...
Read More -
Tier 1 Leverage Ratio
Tier 1 Leverage Ratio is a measurement of bank core capital to its total assets and can be calculated as Tier 1 Capital as a Percen...
Read More


